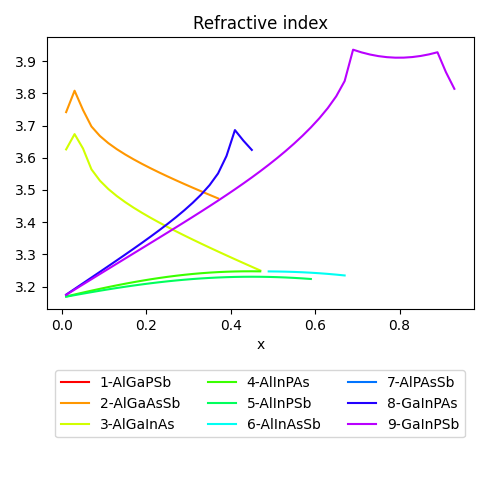
Plot refractive index quaternaries lattice matched inp
Source:
#
#   Copyright (c) 2013-2014, Scott J Maddox
#   Copyright (c) 2025, Duarte Silva
#
#   This file is part of openbandparams.
#
#   openbandparams is free software: you can redistribute it and/or modify
#   it under the terms of the GNU Affero General Public License as published
#   by the Free Software Foundation, either version 3 of the License, or
#   (at your option) any later version.
#
#   openbandparams is distributed in the hope that it will be useful,
#   but WITHOUT ANY WARRANTY; without even the implied warranty of
#   MERCHANTABILITY or FITNESS FOR A PARTICULAR PURPOSE.  See the
#   GNU Affero General Public License for more details.
#
#   You should have received a copy of the GNU Affero General Public License
#   along with openbandparams.  If not, see <http://www.gnu.org/licenses/>.
#
#############################################################################

import numpy as np
from matplotlib import pyplot as plt

from openbandparams.iii_v_zinc_blende_quaternaries import (
    AlGaPSb,
    AlGaAsSb,
    AlGaInAs,
    AlInPAs,
    AlInPSb,
    AlInAsSb,
    AlPAsSb,
    GaInPAs,
    GaInPSb,
    GaInAsSb,
    GaPAsSb
)

from openbandparams.iii_v_zinc_blende_binaries import (
    InP,
    GaAs,
)

substrate = InP
T = 300 #K

x = np.linspace(0.01, 1-0.01, 50)
E0 = 0.8 #eV wavelength at which to calculate the refractive index. 1550nm

configs = {
    'config 0': {'material': AlGaPSb, 'label': 'AlGaPSb', 'y': (0.227+0.040*x)/(0.645+0.040*x)},
    'config 1': {'material': AlGaAsSb, 'label': 'AlGaAsSb', 'y': (0.227+0.040*x)/(0.443+0.033*x)},
    'config 2': {'material': AlGaInAs, 'label': 'AlGaInAs', 'y': (0.189-0.398*x)/(0.405)}, #Corrected formula from guden_piprek
    'config 3': {'material': AlInPAs, 'label': 'AlInPAs', 'y': (0.189-0.398*x)/(0.189+0.020*x)},
    'config 4': {'material': AlInPSb, 'label': 'AlInPSb', 'y': (0.610-0.343*x)/(0.610+0.075*x)},
    'config 5': {'material': AlInAsSb, 'label': 'AlInAsSb', 'y': (0.610-0.343*x)/(0.421+0.055*x)},
    'config 6': {'material': AlPAsSb, 'label': 'AlPAsSb', 'y': (0.267-0.685*x)/(0.476)}, #Corrected formula from guden_piprek
    'config 7': {'material': GaInPAs, 'label': 'GaInPAs', 'y': (0.189-0.405*x)/(0.189+0.013*x)},
    'config 8': {'material': GaInPSb, 'label': 'GaInPSb', 'y': (0.610-0.383*x)/(0.610+0.035*x)},
    'config 9': {'material': GaInAsSb, 'label': 'GaInAsSb', 'y': (0.610-0.383*x)/(0.421+0.022*x)},
    'config 10': {'material': GaPAsSb, 'label': 'GaPAsSb', 'y': (0.227-0.645*x)/(0.443)}
}

lattice_constant = np.zeros((len(configs), len(x)))
bandgap = np.zeros((len(configs), len(x)))
SO = np.zeros((len(configs), len(x)))
refractive_index = np.zeros((len(configs), len(x)))

k=0
for i,config in enumerate(configs):

    if i+1 not in [1,2,3,4,5,6,7,8,9]:
        continue

    alloy = configs[config]['material']
    y = configs[config]['y']

    #Filter for meaningful y values
    idx = np.where((y<1) & (y>0))
    xnew = x

    for j in range(len(xnew)):

        try:
            mat = alloy(x=xnew[j], a = InP.a(T=T))

            Eg =  mat.Eg(T=T)
            Eg_gamma =  mat.Eg_Gamma(T=T)
            if np.isclose(Eg, Eg_gamma):
                lattice_constant[i,j] = mat.a(T = T)
                bandgap[i,j] = mat.Eg_Gamma(T=T)
                SO[i,j] = mat.Delta_SO(T=T)
                refractive_index[i,j] = mat.refractive_index(E0=E0, T=T).real

        except ValueError as e:
            continue


        k+=1

cmap = plt.get_cmap('hsv', len(configs))

figs = []
for data, title in zip([refractive_index],
                       ['Refractive index']):
# for data, title in zip([lattice_constant, bandgap, SO, refractive_index],
#                        ['Lattice constant (angstrom)',
#                         'Bandgap (eV)',
#                         'Spin-orbit splitting (eV)',
#                         'Refractive index']):

    fig = plt.figure(figsize = (5,5))

    ax1 = fig.add_subplot(111)

    for i,config in enumerate(configs):
        if i+1 not in [1,2,3,4,5,6,7,8,9]:
            continue
        name = configs[config]['label']

        data_to_plot = np.copy(data[i])
        data_to_plot[data_to_plot == 0] = np.nan

        ax1.plot(x, data_to_plot, label=f'{i+1}-{name}', color = cmap(i))


    ax1.set_title(title)
    ax1.set_xlabel('x')
    ax1.legend(bbox_to_anchor=(0, -0.3, 1, 0.1), loc='upper center', ncol=3)
    ax1.set_title(title)
    plt.tight_layout(rect=[0, 0.05, 1, 1])
    # fig.savefig(title + '.png', dpi = 400)
    figs.append(fig)

    if __name__ == '__main__':
        import sys
        if len(sys.argv) > 1:
            output_filename = sys.argv[1]
            plt.savefig(output_filename)
        else:
            plt.show()
Result: